This post was updated on 29 October, 2019.
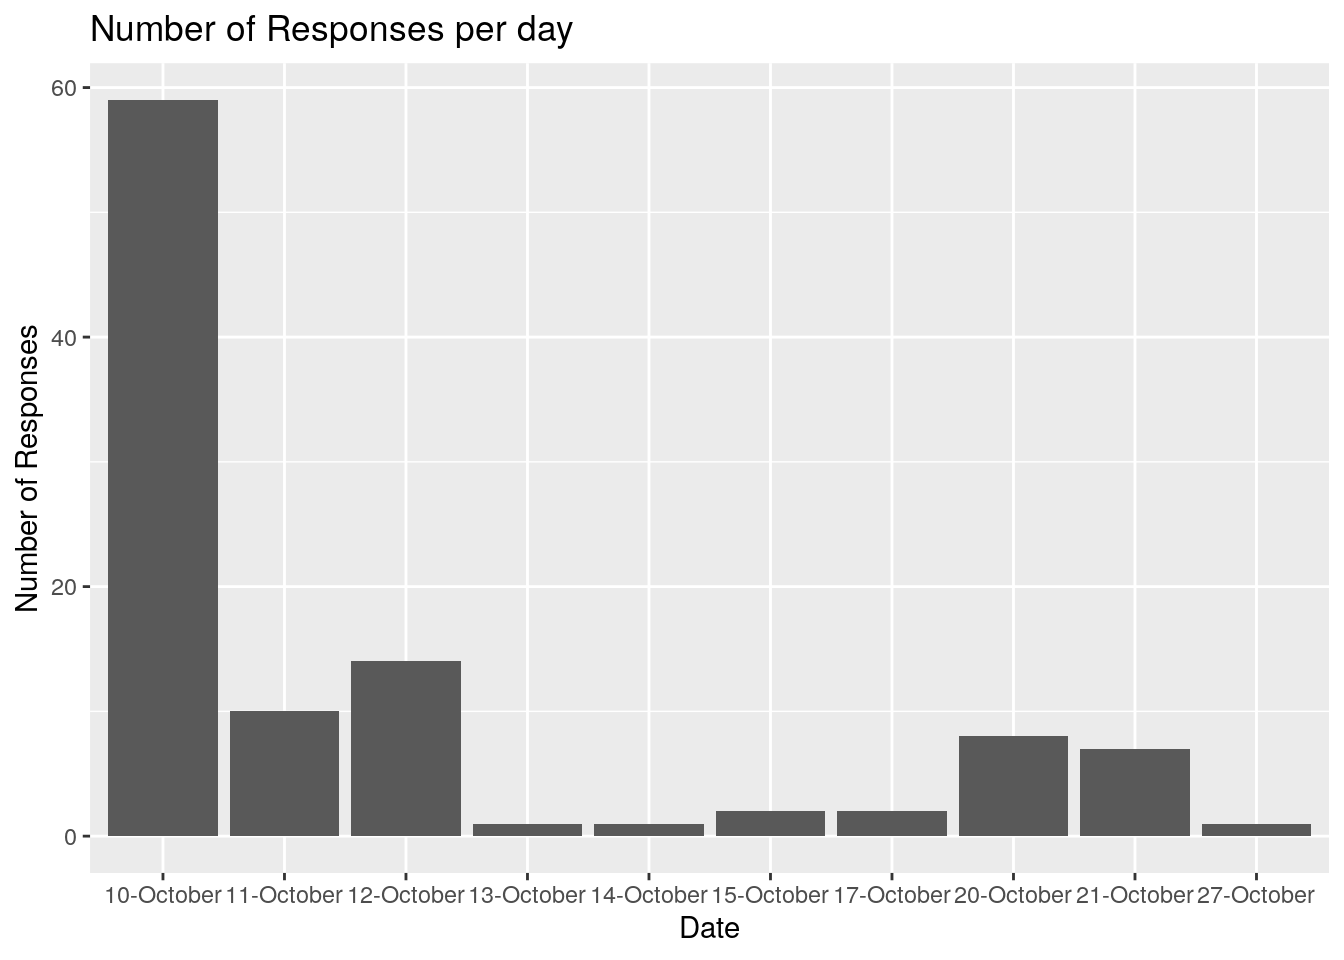
Number of Responses
From 10th October 2019 till 29 October, 2019 we have received 105 responses.
Respondent type
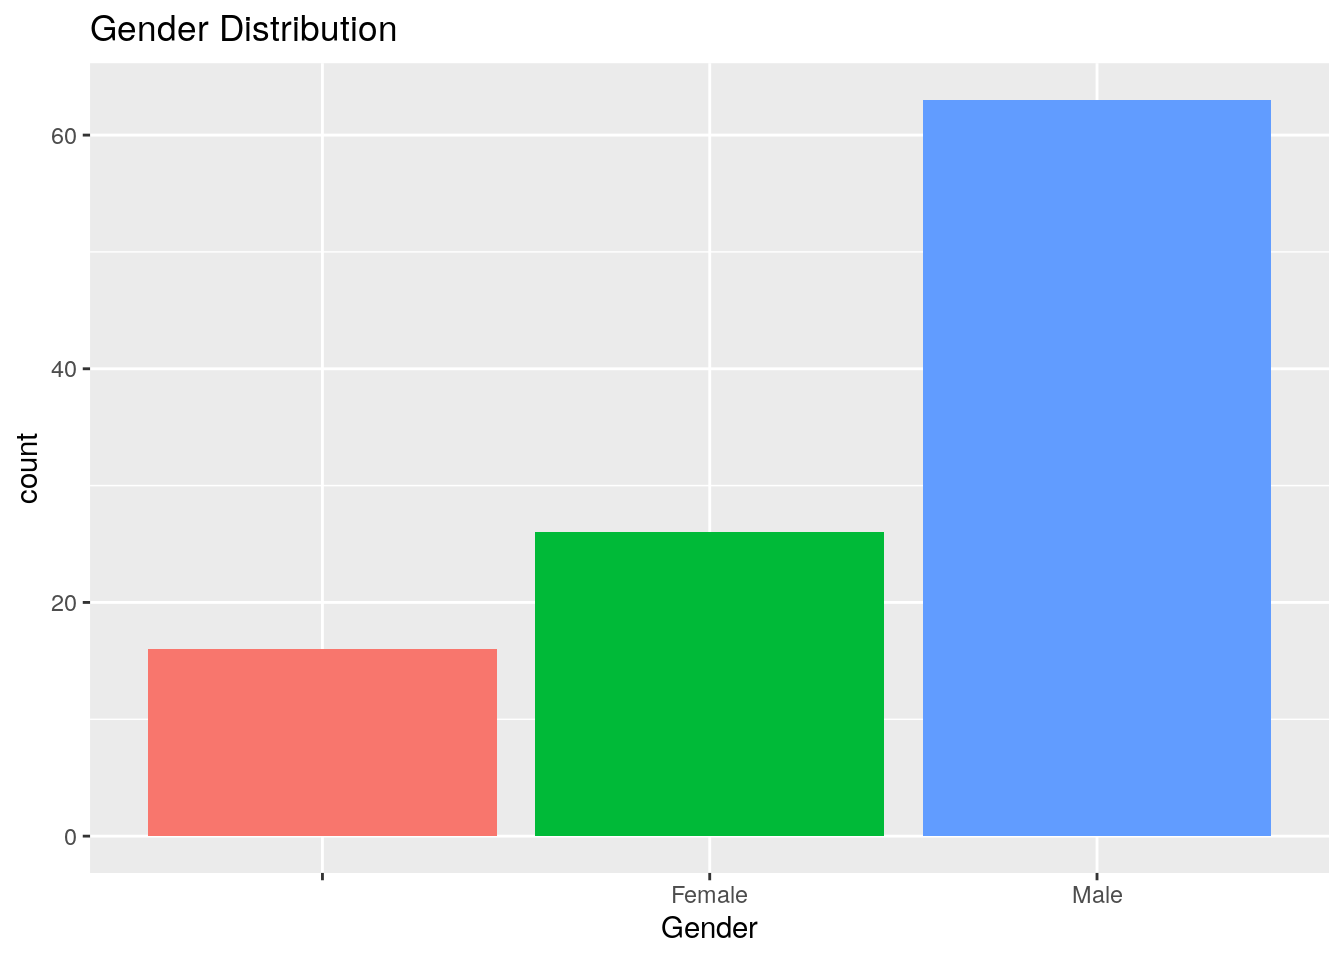
Gender distribution
The following plot shows the gender distribution among the participants.
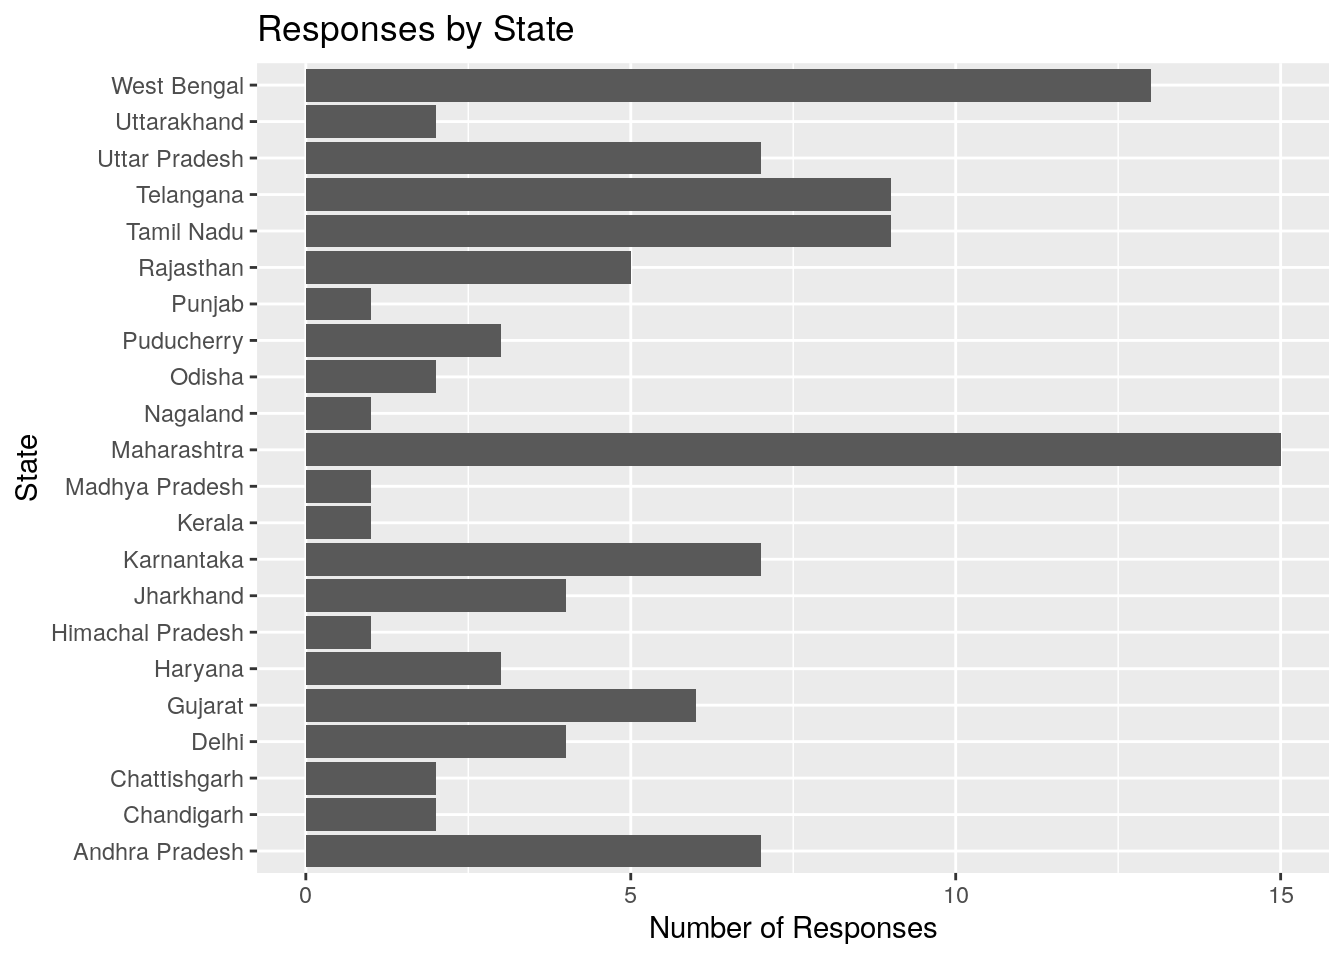
State
The following table shows the state distribution of the participants.
Salary distribution
Radiation Oncologists
First we will take a look at the salary distribution of the radiation oncologists. In the following plot, the dots reprsent the individual reported salary while the red dots represent the mean for the group.
Medical Physicists
The salary distribution of medical physicists is depicted below. Again the red dots indicate the average salary.
Radiotherapy Technologist
The salary distribution of Radiotherapy Technologist is depicted below. Again the red dots indicate the average salary.